Create a simple world map with the borders of countries with R
library(ggmap)
library(data.table)
library(ggplot2)
world <- data.table(map_data("world"))
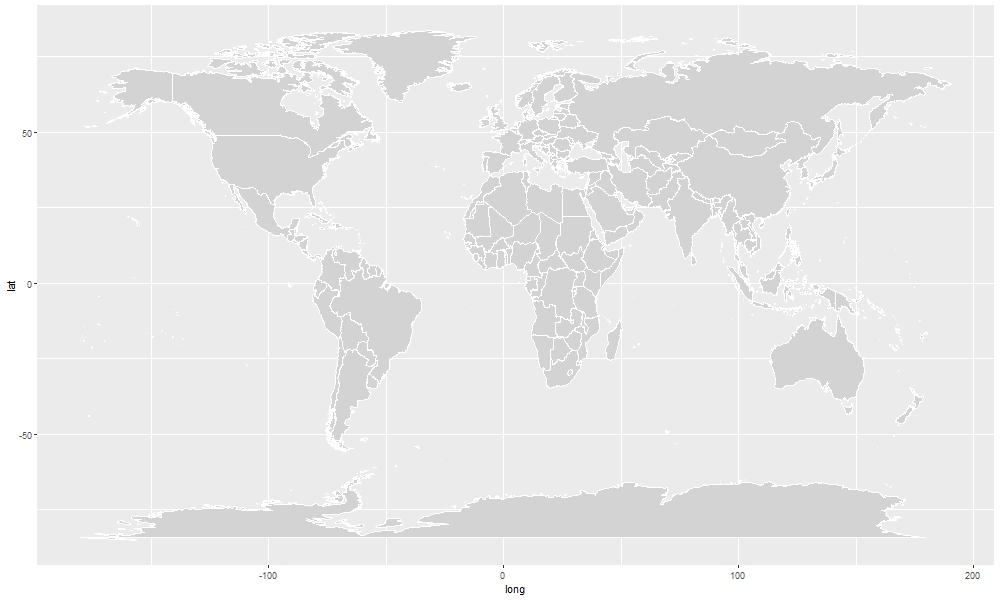
ggplot(world)+
geom_map(map = world, aes(long, lat, map_id = region), color = "white", fill = "lightgray", size = 0.1)
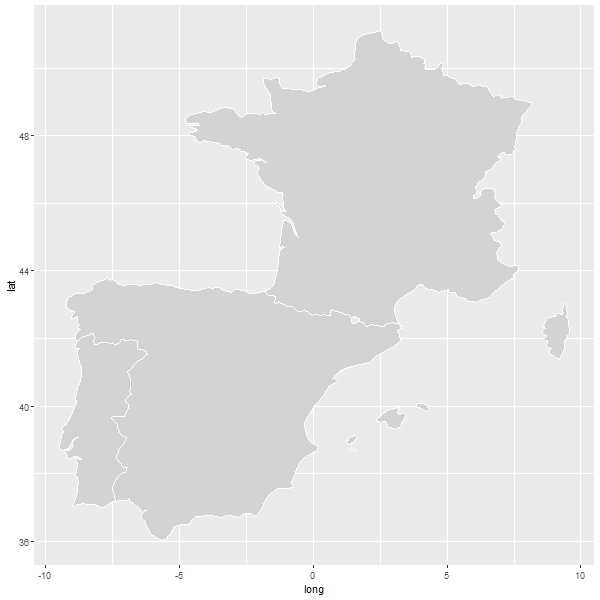
ggplot(world[region %like% "France|Spain|Portuga"])+
  geom_map(map = world, aes(long, lat, map_id = region), color = "white", fill = "lightgray", size = 0.1)