Export coordinates to gpx via R
library(data.table)
library(rgdal)
library(ggmap)

export.gpx <- function(DATA, output) {

  latslongs <- SpatialPointsDataFrame(coords=DATA[, .(lon, lat)], data=DATA, proj4string =CRS("+proj=longlat + ellps=WGS84"))

  writeOGR(latslongs, dsn=output,
           dataset_options="GPX_USE_EXTENSIONS=yes",layer="waypoints",driver="GPX", overwrite_layer = T, )

  data <- data.table(x = readLines(output))
  data <- data[grep("extension", x, invert = T)]
  data[, x := gsub("ogr:url", "url", x)]
  data[, x := gsub(" \\<url", " <url", x)]
  data
  write.table(data$x, output, quote = F, row.names = F, col.names = F)

}

fr

           # lon      lat
   # 1: 4.089971 43.78390
   # 2: 0.404444 44.46160
   # 3: 5.536906 45.57675
   # 4: 5.226620 43.38701
   # 5: 0.780782 46.17596
  # ---
# 2297: 5.322941 44.09015
# 2298: 6.405710 45.28262
# 2299: 6.971918 43.66684
# 2300: 2.802928 44.92323
# 2301: 3.287963 47.94342

export.gpx(fr, "output.gpx")
I can then open them easily on Locus app for example, and you can add how you want tag specific to gpx like <url> or <name> by just having other columns in your table.
Here an output example:
<?xml version="1.0"?>
<gpx version="1.1" creator="GDAL 3.5.2" xmlns:xsi="http://www.w3.org/2001/XMLSchema-instance" xmlns:ogr="http://osgeo.org/gdal" xmlns="http://www.topografix.com/GPX/1/1" xsi:schemaLocation="http://www.topografix.com/GPX/1/1 http://www.topografix.com/GPX/1/1/gpx.xsd">
<metadata><bounds minlat="37.121190100000000" minlon="-9.090287300000000" maxlat="43.583060500000002" maxlon="3.840409000000000"/></metadata>
<wpt lat="40.1854354" lon="-5.0472789">
  <name>Casa Verde Sierra de Gredos</name>
    <url>hidden</url>
    <ogr:lat>40.1854354</ogr:lat>
    <ogr:lon>-5.0472789</ogr:lon>
    <ogr:Country>es</ogr:Country>
</wpt>
<wpt lat="42.8278614" lon="-5.5240025">
  <name>Arbolio</name>
    <url>hidden</url>
    <ogr:lat>42.8278614</ogr:lat>
    <ogr:lon>-5.5240025</ogr:lon>
    <ogr:Country>es</ogr:Country>
</wpt>
<wpt lat="41.2491051" lon="1.2969289">
  <name>Dasca Vives</name>
    <url>hidden</url>
    <ogr:lat>41.2491051</ogr:lat>
    <ogr:lon>1.2969289</ogr:lon>
    <ogr:Country>es</ogr:Country>
</wpt>
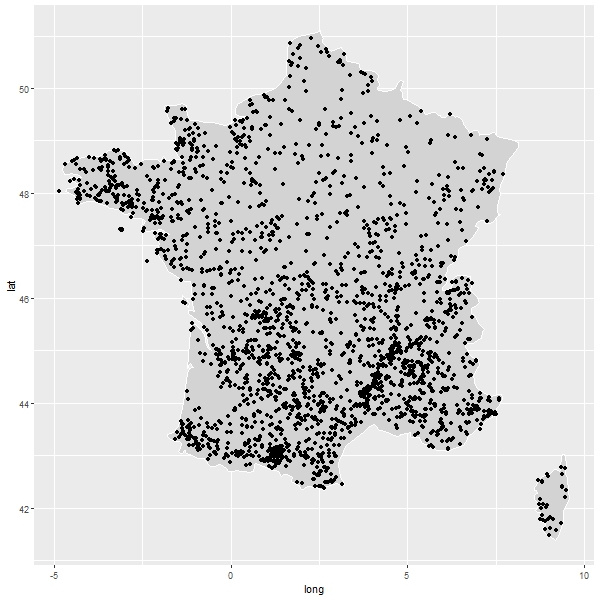
You can also easily plot them:
library(ggmap)
world <- data.table(map_data("world"))

ggplot(world[region %like% "France"])+
  geom_map(map = world, aes(long, lat, map_id = region), color = "white", fill = "lightgray", size = 0.1)+
  geom_point(data = fr, aes(lon, lat))

